Heat Index & Wet Bulb Monitor
WBGT, humidity and heat safety for iPhone
Most weather apps show a "feels like" number that quietly mixes in wind chill. This one computes the heat index itself, and shows the wet bulb, the dew point and an estimated WBGT beside it. All of it for your location, on your Home Screen.
- The NWS equation with both corrections, not a generic feels-like value
- Wet bulb, dew point and an estimated WBGT on one screen
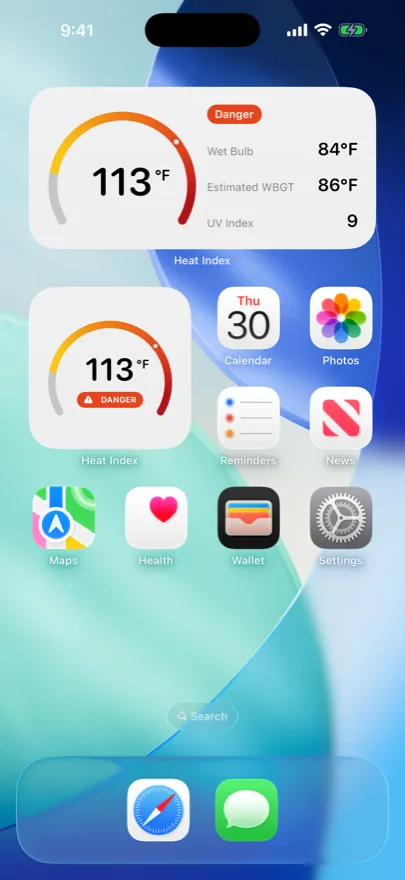
- Home Screen widgets with the published risk band
- No account, no ads, no tracking
Scan to open the App Store listing

Try the maths first
The app computes this continuously from your location. Here it is as a calculator, running the same equation, so you can see the numbers before you install anything.
Four numbers from the same air, answering different questions
Temperature and humidity produce several different quantities, and confusing them is how people end up trusting the wrong threshold. Each of these has its own job.
-
Heat index Four NWS bands
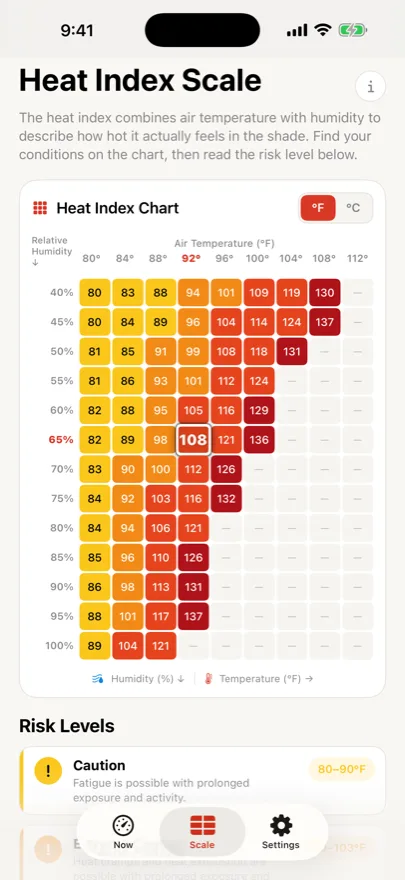
How hot it effectively is for a person in shade, from temperature and humidity. The quantity that heat advisories, school policies and safety guidance refer to. Four published risk categories, and nothing below 80°F, because no published source defines a category down there.
Calculate the heat index -
Wet bulb
The coldest anything can get by evaporation in that air, and therefore a hard physical limit rather than a comfort scale. This is the number behind the 35°C survivability figure.
Calculate wet bulb -
WBGT Estimated
The heat-stress index that occupational and sports rules are written against, because it also includes sun and wind. No weather service reports radiation, so any app-derived WBGT is modelled. This one says so on every value it prints.
Estimate WBGT -
Dew point
How much water the air is actually holding, in degrees. Barely moves through the day, which makes it the right number for comparing a 6am run with a 6pm one.
How the four compare
Calculators
Every one of them runs the published equation and shows its working. None of them needs an account, and none of them sends your inputs anywhere: the arithmetic happens in your browser.
- Heat index calculator Temperature and humidity in, heat index out — with the risk band named and the wet bulb and dew point alongside.
- Wet bulb calculator Wet bulb from temperature and humidity — or from a dew point — with the distance to the 35°C limit spelled out.
- WBGT calculator An estimated WBGT with the flag condition, and the natural wet bulb and black globe shown separately so you can see where the number comes from.
- Printable chart One page, both units, colours that survive a printer — for a noticeboard, a site hut or a classroom wall.
- Work/rest calculator WBGT and workload in, minutes of work and rest per hour out — with the published table underneath and the next step-down named.
- Dog walk checker A yes-or-no answer from the heat index rather than the thermometer, plus an estimated pavement temperature for the surface you are actually walking on.
- Running pace calculator Target pace, temperature and humidity in, an adjusted pace out — built on dew point, which predicts a hard run better than temperature does.
- Acclimatization plan The NIOSH graded schedule as hours for your shift — new workers and returning workers on separate tracks.
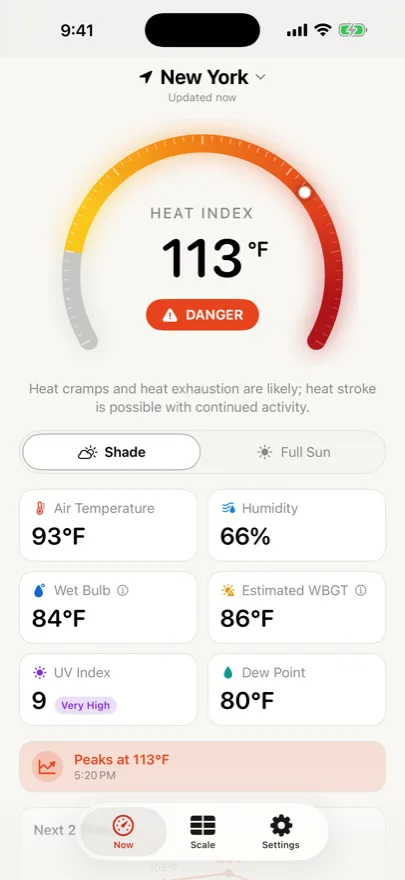
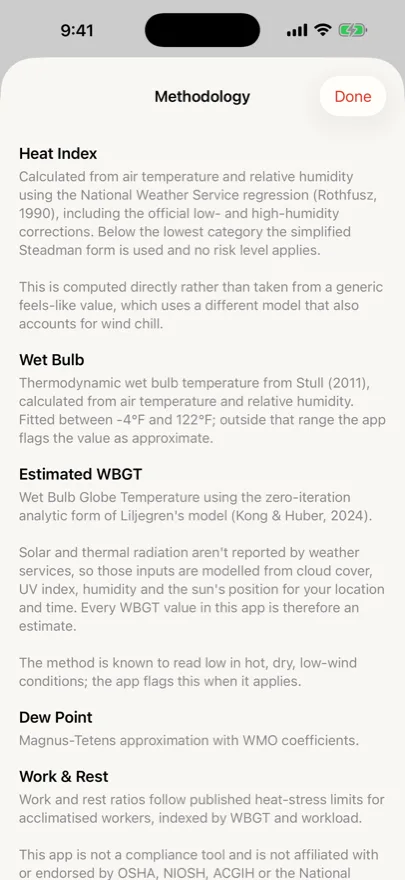
Inside the app
Real screens, not mockups. Every method is named in the app itself, including the one place the WBGT model is known to be weak.
What it does not do
- It does not measure. It computes from weather data for your location. The WBGT radiation terms are modelled, and it says so wherever the value appears.
- It is not an indoor tool. The data is outdoor station data, so it cannot tell you about a warehouse or a bedroom.
- It is not a compliance instrument. Work/rest guidance is a presentation of published tables. A compliance record needs a certified meter.
- It does not deliver official alerts. Heat advisories and Japan's national heat alert are published by agencies; this app is not a channel for them.
- It has nothing to sell you. No account, no advertising SDK, no analytics, no third-party tracking.
Guides and thresholds
Explanations rather than forecasts. Each page answers one question completely: what the number means, where the published line actually sits, and what to do with the answer.
- Wet bulb temperature The measurement, the 35°C survivability limit, why experiments suggest the real line is nearer 31°C, and where on Earth it comes closest.
- WBGT explained The three thermometers and their weights, why the sun is inside the number, and why every app-derived WBGT — including ours — is an estimate.
- Heat index vs feels like Why two apps show different "feels like" numbers for the same weather, and which of the four quantities answers which question.
- The heat index equation The regression in full, both official corrections, the fallback below 80°F, and the twelve chart cells where the printed table disagrees with the equation.
- Walking the dog Thresholds on the heat index, adjusted for breed and age, plus the surface check and what to do instead when the answer is no.
- OSHA and heat What is enforceable now, what the proposed federal rule would add, and why Japan already has the number the US is still debating.
All of it: guides, scenarios and calculators. In Japanese, where the thresholds are statutory: 日本語.